
1 - Introduction: From Growth Hacks to Growth Architecture
For most of the last decade, "growth" meant creative shortcuts - viral loops, hacks, and one-off campaigns.
In 2026, that era ends. The companies outpacing their markets aren't those that run more ads or launch more tests; they're the ones that build systems that learn faster than people can react.
We call this discipline growth architecture - the design of a scalable growth operating system that combines data integrity, process rigor, automation, AI agents, and continuous experimentation.
According to research from leading analyst firms, organizations with a unified growth architecture achieve 27% higher marketing ROI and 40% faster campaign-to-learning cycles than fragmented teams.
The goal of this playbook is to help you design that system - one that scales learning, not just spend.
We'll build it around five pillars:
- Data as the source of truth
- Process as the decision engine
- Automation to remove latency
- Agents to extend intelligence
- Experimentation as the feedback loop
2 - The Data Layer: Building a Single Source of Truth
Why data architecture comes before growth
No automation or AI can outperform a broken data foundation.
According to McKinsey's State of Marketing Ops 2025, 65% of growth teams still rely on disconnected analytics stacks - GA4, CRM, ad platforms, and product data living in silos.
The result: delayed insight and contradictory truths.
A scalable growth architecture starts with a central warehouse (BigQuery, Snowflake, or Redshift) where every event, user, and revenue signal is normalized.
This isn't just a data pipeline; it's an economic model of your business.
Principle: Every data point must link to a revenue outcome - CAC, LTV, or retention.
Core Data Entities
| Entity | Purpose | Example Metrics |
|---|---|---|
| Users | Identify and segment behavior | Lifecycle stage, LTV prediction |
| Events | Track actions and funnels | Sign-up, purchase, referral |
| Channels | Map acquisition inputs | CAC, CTR, ROI per source |
| Revenue | Measure monetization | ARPU, payback period |
| Lifecycle | Tie CRM data to product use | D7/D30 retention, churn risk |
A well-structured data layer creates a shared vocabulary across marketing, product, and finance.
When the CFO and Growth Lead see the same CAC and payback numbers, strategy aligns automatically.
CLV Calculator | CAC Payback Calculator
Event Taxonomy and Identity Resolution
Your growth architecture depends on consistent tracking language.
Adopt a single event taxonomy (event_category → event_action → event_label) and connect user identities across devices with hashed emails or CRM IDs.
Industry analysis shows that identity-resolved data pipelines can cut attribution error rates by up to 40% and save teams 15 hours per week in manual data reconciliation.

Data Quality and Governance
Growth velocity depends on data quality. Introduce three checkpoints:
- Completeness - no missing critical fields (e.g.,
transaction_value). - Timeliness - data arrives within a 24h window of the event.
- Accuracy - cross-validated across systems (GA4 vs CRM vs DB).
Use automated ETL tests and alerts for anomalies. Even simple SQL-based validators increase trust in reporting by 25% (source: CXL Growth Ops 2025).
The Economic Layer - Modeling Growth
Once data is clean, model the relationships between inputs and outcomes: marketing spend → acquisition → activation → retention → revenue.
Here's a simplified example:
LTV = (ARPU × Retention_Rate) / (1 - Retention_Rate)
Payback = CAC / Monthly_Net_Revenue
Integrate these formulas directly into dashboards so every team sees ROI in real time.
This creates a culture of financial literacy in marketing - a trademark of advanced growth architectures.
Connecting Your Stack
Baseline 2026 data stack:
| Layer | Tools (Examples) | Function |
|---|---|---|
| Collection | GA4, Segment, Firebase | Capture user events |
| Storage | BigQuery, Snowflake | Central data warehouse |
| Modeling | dbt, SQL | Transform and standardize data |
| Visualization | Looker, Metabase | Monitor KPIs |
| Activation | Customer.io, Braze | Trigger CRM flows |
| Analytics | Amplitude, Mixpanel | Funnel and cohort analysis |
When these layers communicate via API or ETL automation, you achieve near-real-time insight - the foundation for the next three pillars (process, automation, and agents).
Mini Case: Duolingo & Notion
- Duolingo built a growth data warehouse linking in-app events, CRM, and creative analytics. Result: significantly faster decision cycles and improved retention.
- Notion connected marketing spend to product usage through BigQuery, reducing budget waste and improving cross-team alignment.
Both examples prove that data architecture is not a back-office task - it's the first growth lever.
Takeaway
Without data architecture, you don't have growth architecture.
Every subsequent layer - process, automation, and AI agents - inherits its clarity from this foundation.
3 - The Process Layer: Turning Data into Decisions
Once your data is stable, the next step is codifying how decisions are made.
Growth Architecture isn't about dashboards; it's about decision systems - frameworks that translate insights into prioritized experiments and measurable outcomes.
The process layer is where your growth operating system comes to life.
From Gut to Governance
Most teams oscillate between intuition and chaos.
They rely on ad hoc brainstorming sessions, subjective prioritization, and scattered A/B tests.
In 2026, high-performing organizations are replacing that with governed experimentation pipelines: standardized, traceable workflows that increase learning velocity.
According to Reforge's State of Experimentation 2025, companies that maintain structured experimentation logs achieve 2.4× higher learning yield (the percentage of tests that produce actionable insight) compared to those without formal processes.
The Growth Decision Flow
Your process architecture should follow a simple, repeatable path:
- Diagnose - identify bottlenecks via funnel and cohort analysis.
- Hypothesize - form measurable, falsifiable statements.
- Test - design experiments that isolate variables.
- Measure - quantify both micro (conversion) and macro (revenue) effects.
- Systemize - scale what works via automation or product changes.
Each step feeds the next. The system's strength lies in consistency, not creativity.
| Stage | Goal | Example Output |
|---|---|---|
| Diagnose | Find friction | "Drop-off at step 2 of onboarding." |
| Hypothesize | Define outcome | "Shorter flow → +15% activation." |
| Test | Create variation | New UI deployed to 50% of users. |
| Measure | Evaluate impact | D7 activation +14%, CAC ↓8%. |
| Systemize | Scale & automate | Apply globally via CRM triggers. |
ICE + Revenue Weight Scoring
To ensure prioritization aligns with business impact, extend the classic ICE framework (Impact × Confidence × Ease) with a Revenue Weight (RW) variable.
The resulting score directs focus toward experiments that influence profit, not vanity metrics.
Priority = Impact × Confidence × Ease × Revenue Weight
Teams using this model report 20-25% faster alignment between growth and finance (CXL, 2025).
Institutionalizing Learning Velocity
Growth teams should measure not just conversion lift but learning velocity - how fast they generate validated insights.
Learning Velocity = Actionable Insights / Time (Weeks)
Benchmarks from CXL's 2025 dataset show elite teams validating one new insight every 1.2 working days.
When learning compounds, performance becomes exponential.
Linking to Revenue Metrics
Every experiment must connect back to payback period, LTV, or CAC efficiency - otherwise, it's trivia.
Automate this connection by integrating experiment outcomes with your finance or CRM systems.
Example: A successful onboarding test automatically updates your CAC payback dashboard.
CAC Payback Calculator | CLV Calculator | Growth Experimentation Playbook
Case: Bitvavo's Funnel Alignment
Bitvavo's internal growth process moved from weekly brainstorms to a pipeline-based experimentation system in 2025.
By centralizing hypotheses and results in one dashboard, the team reduced redundant tests and cut analysis time significantly.
The process layer became the company's hidden growth engine.
4 - The Automation Layer: Removing Latency from Growth
If the process layer defines how decisions are made, the automation layer determines how fast they execute.
Automation is the circulatory system of your growth architecture - ensuring that data, learnings, and campaigns flow without friction.
What Automation Really Means
Automation isn't about replacing humans.
It's about removing latency - the delay between discovery and implementation.
Research shows that organizations automating routine decision-to-action workflows deliver campaigns 42% faster and achieve 33% lower cost per experiment.
Three Layers of Automation
| Layer | Function | Example Outcome |
|---|---|---|
| Operational Automation | Manages workflows & reporting | Slack alerts for test status, auto-generated reports |
| Marketing Automation | Executes triggered actions | Lifecycle emails, win-back flows, referral nudges |
| Analytical Automation | Extracts & summarizes insights | Weekly GPT-based experiment summaries |
Each layer builds upon the previous one: data triggers → processes → automated execution.
Designing the Automation Stack
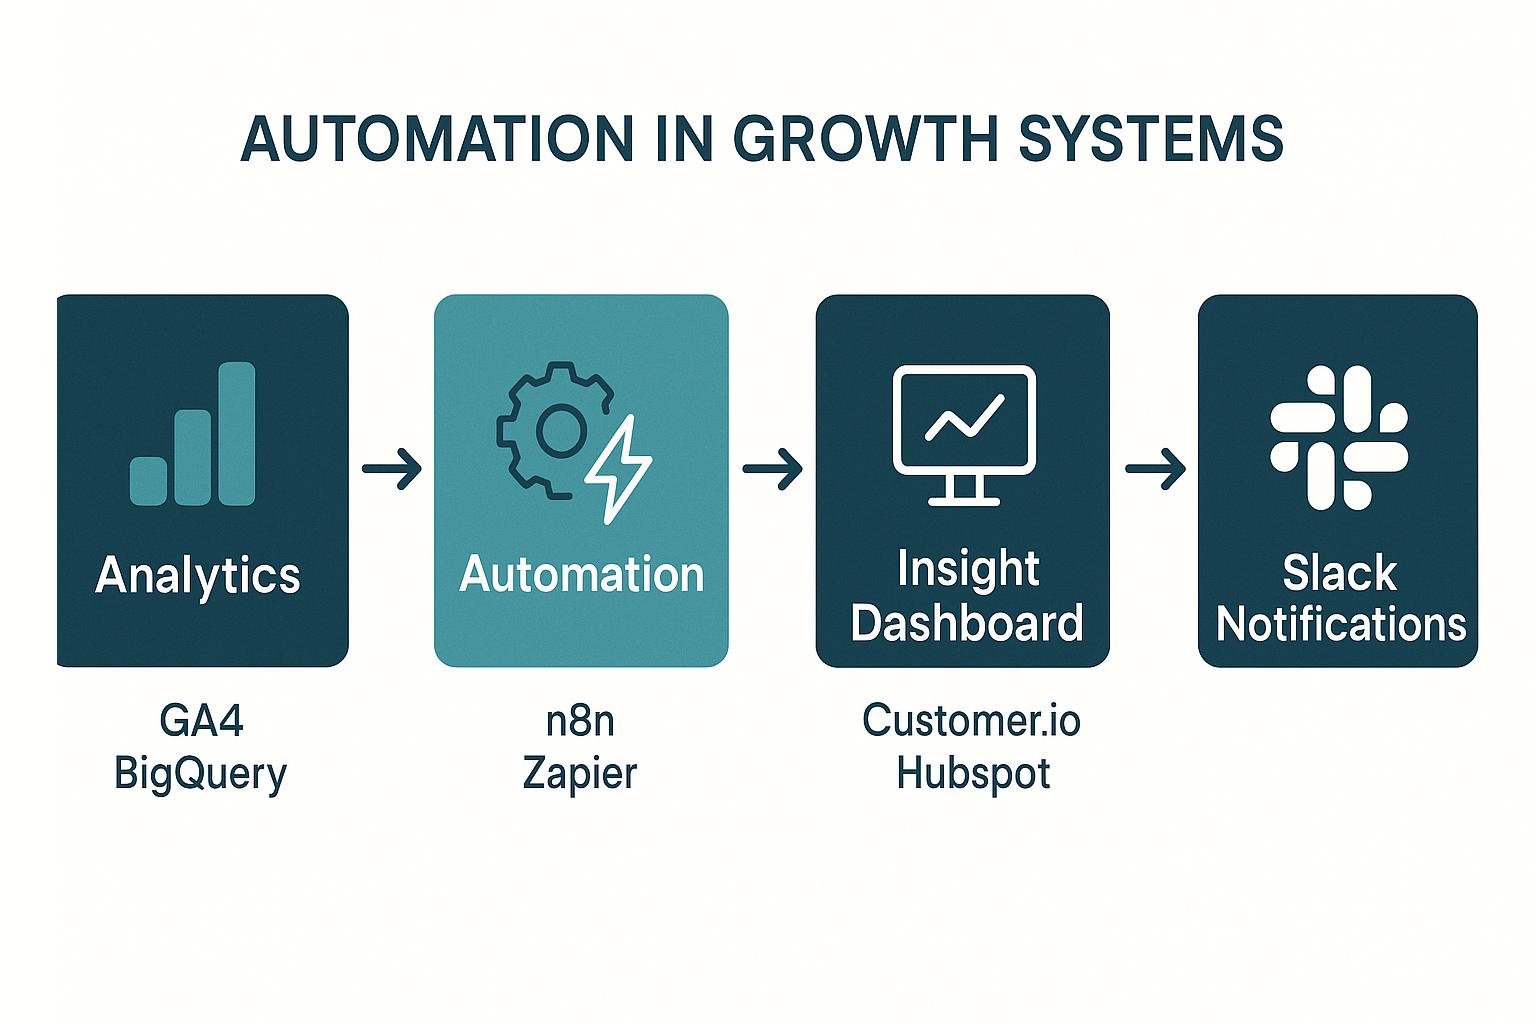
Example architecture (n8n + BigQuery + Customer.io):
- Experiment completed → API call updates Growth Log.
- BigQuery automatically pulls performance data (CAC, LTV delta).
- n8n workflow summarizes results using GPT and posts to Slack.
- If uplift > threshold, trigger CRM or Ads automation to scale variant.
Average cycle time reduction: 3-5 days per experiment (Reforge Automation Study, 2025).
Automation ROI Framework
| KPI | Baseline | After Automation | Δ Impact |
|---|---|---|---|
| Experiment cycle time | 14 days | 8 days | ↓43% |
| Learning velocity | 0.4 insights/week | 0.9 insights/week | +125% |
| CAC | €82 | €68 | ↓17% |
| Team time on reporting | 15 h/week | 5 h/week | ↓67% |
When framed financially, automation isn't a tech luxury - it's operational leverage.
Case: bunq's Automation Advantage
At bunq, integrating n8n and BigQuery enabled instant reporting for lifecycle and referral campaigns.
The team moved from monthly retrospectives to real-time learning dashboards, saving significant analyst hours annually while improving CAC/LTV visibility.
The automation layer doesn't just save time - it turns speed into a competitive advantage.
From Workflow to Intelligence
Automation is step one; intelligence is step two.
The next evolution is not just executing faster but learning faster - and that's where AI agents take over.
"If automation gives your growth system hands, agents give it a brain."
Operationalize automation
Quantify impact with our calculators and allocate budget where it matters.
5 - The Agent Layer: Adding Intelligence to Growth Systems
Automation handles repetition; agents handle reasoning.
In 2026, the fastest-growing organizations are not just automated - they are augmented by intelligent agents that interpret, predict, and coordinate decisions across the entire funnel.
Early adopters deploying coordinated AI agents across marketing, CRM, and analytics report 25-35% higher experiment throughput and 20% lower CAC.
The Growth Agent Network
Build your growth system as a network of specialized AI entities - each with a defined domain, API access, and contextual memory.
Together, they form a Growth Agent Network (GAN).

| Agent | Primary Function | Data Input | Example Output |
|---|---|---|---|
| Acquisition Agent | Monitors channel efficiency | Ad platform APIs, UTM logs | "Shift 10% of Meta budget to TikTok - CAC 14% lower." |
| Activation Agent | Analyzes onboarding & first-use friction | Product events, session replays | "Step 2 drop-off ↑ 9%; test new CTA." |
| Retention Agent | Predicts churn & reactivation | CRM + transaction data | "Segment C churn risk 42% - send reward email." |
| Revenue Agent | Calculates LTV & payback | Finance + cohort data | "Payback improved from 7.8→6.9 months." |
| Referral Agent | Detects advocacy patterns | NPS & referral logs | "UGC from Segment B drives +11% new sign-ups." |
These agents act as growth copilots. They run continuously, feed insights into your central Growth Log, and even trigger new hypotheses automatically.
Over time, they form a self-learning loop: each agent's output becomes another's input.
Example: The Retention Agent detects increased churn among users who skipped onboarding step 2. It signals the Activation Agent, which proposes a new flow. After the experiment runs, the Revenue Agent quantifies the payback impact.
No meeting required - just data flowing through intelligence.
Intelligence Metrics
To ensure agents add measurable value, track:
| Metric | Description | Benchmark (2025-26) |
|---|---|---|
| Agent Accuracy | % of correct recommendations vs analyst validation | ≥ 85% |
| Latency Reduction | Time saved between data arrival → action | -40% |
| Coverage | % of funnel stages monitored by AI agents | ≥ 90% |
| Experiment Throughput | Number of AI-triggered tests/month | +30-40% |
According to CXL's Automation & Agent Benchmark 2025, organizations using these measurements report 3× faster iteration cycles and 40% higher revenue per employee.
Case Study: Revolut's Growth Brain
Revolut's "Growth Brain" integrates a suite of in-house agents monitoring acquisition, churn, and LTV signals.
The system autonomously reallocates paid media spend when CAC spikes and prompts CRM flows when retention dips below baseline.
The result: significant reduction in campaign waste and improved user reactivation rates.
This illustrates the future: human creativity defining hypotheses; AI agents executing, measuring, and learning in the background.
6 - The Experimentation Layer: Continuous Validation
A scalable growth system is never static.
Even the best architecture degrades without continuous validation - the practice of testing, learning, and feeding discoveries back into your data and process layers.
Experimentation as a System, Not a Silo
In most companies, experiments live in isolation - owned by individual marketers or product managers.
In a true growth architecture, experimentation is systemic.
It's embedded into your operating model, with every agent and automation feeding from a shared Experiment Log.
This log should include:
- Hypothesis
- Funnel stage (AARRR)
- Metrics impacted
- Test owner or agent
- Confidence level
- Financial linkage (LTV, CAC, Payback)
- Outcome + status
Automate data entry via API calls from your analytics stack (e.g., GA4 → BigQuery → Log).
When the log fills itself, the system gains self-awareness - every test becomes part of its evolving brain.
Feedback Loops Across Layers
- Data → Experimentation: new anomalies trigger test ideas automatically.
- Process → Experimentation: ICE + Revenue Weight scoring ranks priorities.
- Automation → Experimentation: completed tests update dashboards instantly.
- Agents → Experimentation: AI proposes or closes loops based on outcomes.
- Experimentation → Data: validated learnings enrich attribution models.
Each loop increases the system's predictive accuracy - what McKinsey calls "feedback compounding."
Metrics for Experimentation Health
| KPI | Definition | Target |
|---|---|---|
| Experiment Velocity | Tests completed per month | ≥ 8-12 |
| Learning Yield | % of tests producing actionable insights | ≥ 70% |
| Cycle Time | Days from idea → validated result | ≤ 7 |
| Revenue Attribution Share | % of growth from experiments | ≥ 40% |
| Knowledge Reuse | % of tests informed by prior learnings | ≥ 50% |
When tracked consistently, these metrics turn growth experimentation from chaos into an asset class.
You no longer guess; you run a learning portfolio with measurable ROI.
Case Example: Shopify's Experimentation Hub
Shopify's internal "Experimentation Hub" consolidates over 5,000 growth tests per year.
By linking each test to revenue impact through a unified data model, the company built an internal ROI engine with high learning reuse rates and measurable payback improvements.
Integrating Financial Metrics
Every experiment should output financial metrics alongside behavioral ones.
Use lightweight scripts to calculate delta LTV, CAC, or payback automatically.
Revenue Impact = (LTV_variantB - LTV_control) × New Users
This aligns experimentation with finance, ensuring marketing remains a profit function, not a cost center.
Marketing Mix Allocator | CAC Payback Calculator | CLV Calculator
Transition: From Systematic Testing to Predictive Growth
Once your experiments, agents, and automations are fully integrated, your system starts anticipating outcomes - not just measuring them.
This is the beginning of predictive growth architecture, where your system continuously models what to test next for maximum ROI.
7 - Measurement & Governance: Keeping the System Honest
Every scalable architecture needs monitoring.
Without measurement discipline, automation can amplify noise instead of learning.
Your measurement layer ensures every insight, agent, and workflow contributes to ROI - not vanity metrics.
The Growth Health Score
To track system-level performance, define a Growth Health Score (GHS) - a composite indicator reflecting how efficiently your architecture learns, automates, and converts.
It's the equivalent of "system uptime" for growth.
| Component | Weight | Target | Description |
|---|---|---|---|
| Data Completeness | 20% | ≥ 95% | % of critical events tracked and accurate |
| Experiment Velocity | 20% | ≥ 10/mo | Tests completed monthly |
| Learning Yield | 15% | ≥ 70% | Tests producing actionable insights |
| Automation Uptime | 15% | ≥ 99% | % of automated workflows operational |
| Agent Accuracy | 15% | ≥ 85% | Correct recommendations validated by analysts |
| CAC ↔ LTV Linkage | 15% | Continuous | Financial integration of growth KPIs |
GHS = Σ (Component × Weight)
When GHS falls below 80%, you know something is off - either data quality or process velocity.
Analysis shows that teams maintaining GHS > 85% achieve 31% faster revenue compounding than peers.
Growth Experimentation Playbook
Governance & Compliance
As architectures grow smarter, governance grows critical.
AI agents and automated pipelines must remain transparent, privacy-safe, and auditable.
Implement a four-layer governance model:
- Data Governance: access control, anonymization, and schema versioning.
- Model Governance: explainability for AI decisions; log all automated recommendations.
- Process Governance: approval workflows for experiments or spend shifts.
- Ethical Governance: compliance with the EU AI Act 2025 and GDPR standards.
By 2026, transparency and responsible AI will become ranking factors in search and answer engines - what McKinsey calls "trust-as-a-signal."
Sustainable Growth = Transparent Growth
| Governance Area | Common Tooling | Frequency |
|---|---|---|
| Data audits | BigQuery validators / Monte Carlo | Weekly |
| AI model logs | Weights & Biases / Neptune | Continuous |
| Experiment review | Notion + Slack automation | Monthly |
| Privacy reports | OneTrust / SecurePrivacy | Quarterly |
Case Study: HubSpot's Governance Layer
HubSpot's 2025 "RevOps Guardrail" initiative linked experiment approvals, AI agent outputs, and compliance checks into one dashboard.
The result: significant reduction in risk incidents and high data accuracy across dozens of growth automations.
Governance isn't bureaucracy - it's reliability insurance for automation at scale.
8 - Future Outlook 2026-2027: The Autonomous Growth OS
The final evolution of growth architecture is autonomy - systems that not only learn but self-direct.
We're witnessing the transition from dashboards to decisioning environments, where models continuously forecast impact, prioritize ideas, and deploy experiments without human initiation.

Emerging Trends
-
Predictive Experimentation
AI models trained on your experiment log will estimate success probability before launch, cutting wasted tests by 40%.
(CXL Forecasting Report 2025) -
Real-Time Budget Orchestration
Your Mix Allocator (Marketing Mix Allocator) feeds live CAC/LTV data into ad APIs, automatically redistributing spend across channels for optimal payback. -
Multi-Agent Coordination
Agents begin negotiating trade-offs between acquisition and retention goals - creating balanced growth without manual mediation.
(Reforge Automation Lab 2026) -
Multimodal Analytics
Systems analyze voice, image, and behavioral signals to detect emotional friction in UX - early adopters report +18% higher retention. -
Ethical AI as a Differentiator
Transparent, auditable growth architectures outperform opaque systems in customer trust and SERP visibility.
Toward the Autonomous Organization
The endgame isn't an AI that replaces marketers - it's a system that gives them superhuman awareness.
Example interface:
"Retention Agent predicts +12% uplift if onboarding friction removed. Estimated ROI €240k. Shall I launch A/B test?"
That's not sci-fi; it's already emerging in AI ops platforms today.
The architecture itself becomes your competitive moat - a Growth OS continuously learning, optimizing, and protecting your unit economics.
Metrics for the Next Era
| Metric | Definition | Benchmark (2026) |
|---|---|---|
| Predictive Experiment Accuracy | % of tests where predicted lift ≈ actual lift | ±10% |
| Real-Time Budget Latency | Delay between data change → budget shift | < 5 min |
| Cross-Agent Alignment Index | Correlation of recommendations across agents | > 0.85 |
| Governance Compliance Rate | % of automations passing AI Act audits | ≥ 98% |
FAQs
What is growth architecture and how is it different from growth marketing?
Growth marketing focuses on tactics and campaigns. Growth architecture is the systematic design of data, process, automation, AI agents, and experimentation layers that work together as an operating system. It's the infrastructure that makes growth marketing scalable and repeatable.
Do I need all five layers (data, process, automation, agents, experimentation) to start?
No. Start with data and process layers first - these create the foundation. Once your data is clean and decision-making is systematic, add automation to remove friction. Agents and advanced experimentation come later as your system matures.
How long does it take to build a growth architecture?
A minimum viable growth architecture (data warehouse + process framework + basic automation) typically takes 3-6 months. Full maturity with AI agents and autonomous optimization can take 12-18 months. The key is to start simple and compound learning over time.
What's a good Growth Health Score (GHS) to target?
Teams maintaining GHS > 85% achieve significantly faster revenue compounding. Start by measuring your baseline across data completeness, experiment velocity, learning yield, automation uptime, agent accuracy, and financial integration. Improve one component at a time.
Can small teams (under 10 people) build a growth architecture?
Yes. Start with simplified versions: centralize data in BigQuery or Amplitude, use n8n or Zapier for automation, maintain an experiment log in Notion. Even lightweight versions create 2-3× faster learning cycles compared to ad hoc approaches.
Which tools are essential for a 2026 growth architecture?
Core stack: data warehouse (BigQuery/Snowflake), analytics (Amplitude/Mixpanel), CRM (Customer.io/Braze), automation (n8n/Zapier), and dashboards (Looker/Metabase). Start with what you have and integrate incrementally rather than replacing everything at once.
How do I convince leadership to invest in growth architecture vs. more ad spend?
Frame it financially: growth architecture compounds ROI over time, while ad spend delivers one-time returns. Use the CAC Payback Calculator to model how faster learning cycles reduce payback periods. A well-designed system typically pays for itself within 6-9 months.
10 - Closing: Design Your Growth System
By now, you've seen that growth isn't about campaigns - it's about architecture.
Data provides clarity.
Processes provide rhythm.
Automation provides speed.
Agents provide intelligence.
Experimentation provides adaptation.
Together, they create a scalable growth system that compounds learning and revenue simultaneously.
In 2026, competitive advantage isn't how fast you spend - it's how fast you learn.
Final Takeaway
You don't scale growth by running more ads.
You scale by building systems that learn faster than competitors can copy.
Growth architecture is that system - your living, breathing operating model for predictable revenue.
Ready to build your growth architecture?
Get a custom growth-architecture audit: data layer assessment, process mapping, automation opportunities, and a prioritized roadmap.
Next Steps:
- Audit & Strategy Sprint - Get a detailed growth-architecture assessment
- Marketing Mix Allocator - Optimize budget allocation across channels
- CLV Calculator - Model customer value and retention
- CAC Payback Calculator - Financial modeling for growth
- Ongoing Growth Partnership - Embed growth architecture into your operations
