Growth Experimentation Playbook 2025: How to Build a Process That Drives Revenue
Growth experimentation in 2026 is about learning velocity, not test volume. Build a scientific system with a prioritized hypothesis backlog, AARRR metrics, statistical guardrails, and automation that links every A/B test to revenue, so each experiment compounds into predictable growth intelligence.
Turn hypotheses into profit with scientific testing
Build a systematic approach to growth experimentation that compounds learning and drives measurable revenue outcomes.
Growth experimentation in 2025 isn't about running more tests-it's about building a system that learns faster. The best-performing companies use the scientific method, AARRR metrics, and automation to turn experiments into predictable revenue.
What you get:
- The scientific method adapted for growth teams with revenue-linked outcomes
- AARRR framework (Acquisition → Activation → Retention → Revenue → Referral) for structured testing
- Automation layer and AI agents that remove bottlenecks and accelerate learning velocity
- Proven strategies to solve low-data, inconclusive results, and coordination debt
Table of Contents
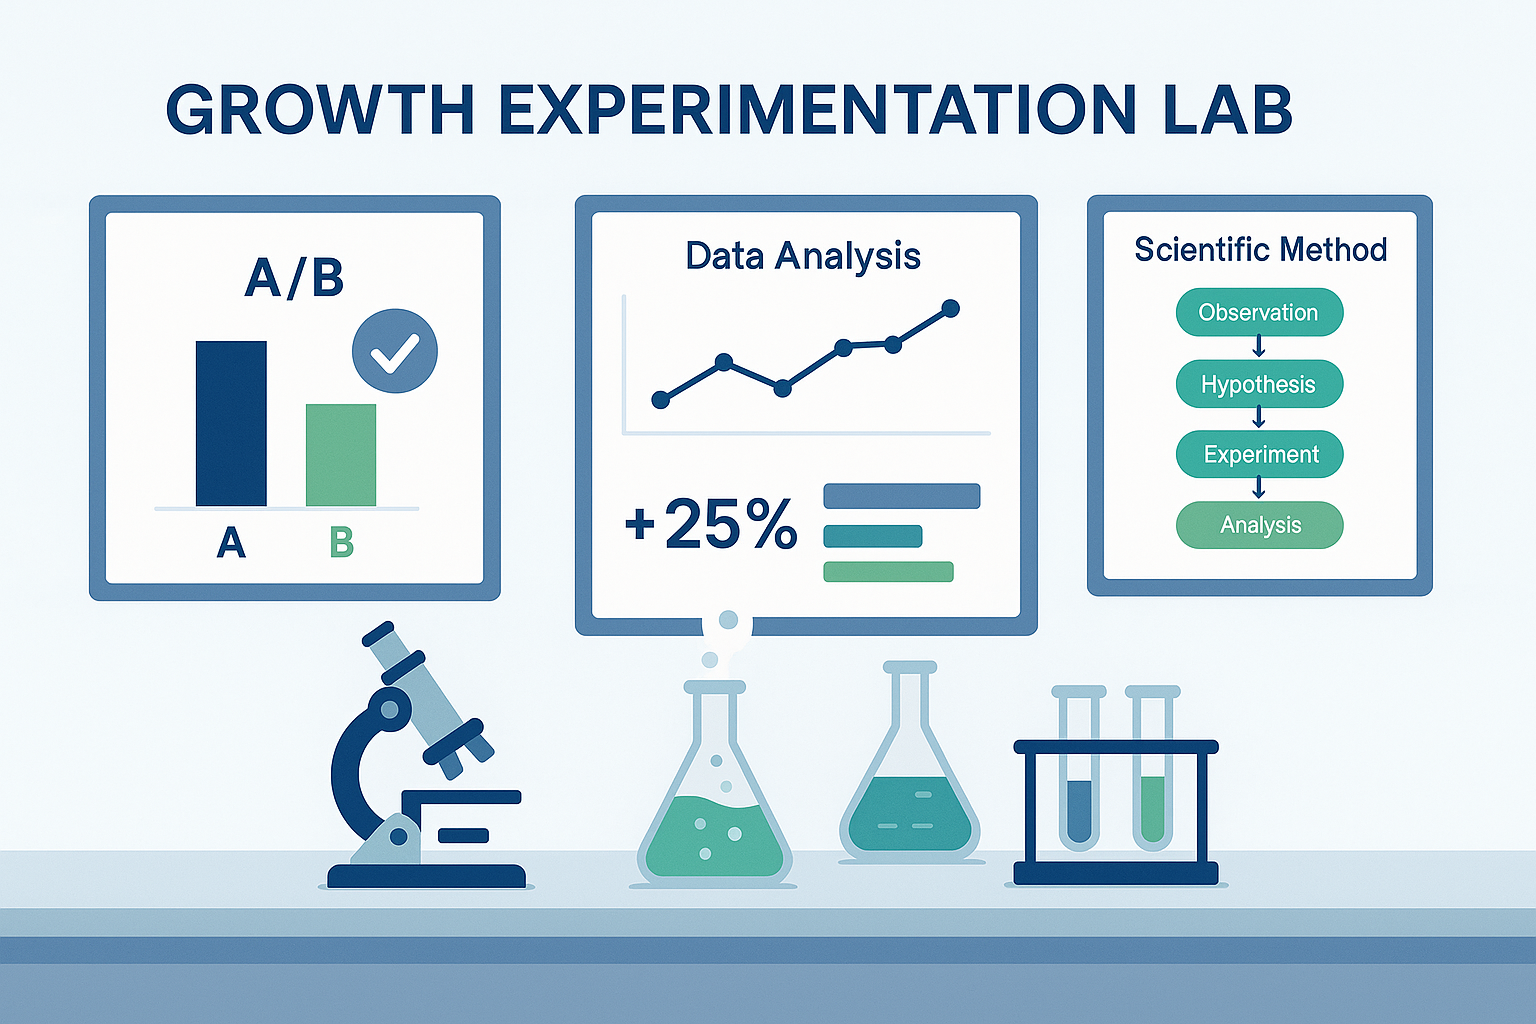
1. The Scientific Method for Growth Teams
The fastest-growing companies operate like laboratories. They approach marketing and product changes through the lens of a proven scientific loop popularized by Brendan Regan's Scientific Method for Marketers. That loop contains eight precise steps:
- Define the problem. Identify the biggest friction in your funnel. Where do users drop off? Which channel is inefficient? Replace gut feeling with a quantified bottleneck.
- Research the problem. Pull behavioral data (GA4, Amplitude, Hotjar), user feedback, and qualitative insight. Understand why the issue exists before imagining a fix.
- Form a hypothesis. State it in measurable terms: "If we shorten the onboarding flow from four screens to two, activation will rise 15 percent because friction is reduced."
- Run the experiment. Build a control and variation. Keep external conditions consistent. Choose a sample size large enough to reach directional significance.
- Analyze results. Look beyond p-values. Evaluate the effect on downstream metrics such as payback and LTV.
- Draw conclusions. Was the hypothesis correct? If yes-why? If not-what new insight emerged?
- Publish learnings. Centralize results in a shared "Growth Log." Each entry should include hypothesis, metric, outcome, and estimated revenue delta.
- Re-test or scale. Confirm winners over multiple cycles, then automate the variant into CRM flows, ads, or product defaults.
This structure transforms experimentation from chaos into a knowledge-compounding system. Each run adds to the collective understanding of what drives your revenue curve.
💡 Key Takeaway
By explicitly tying each step to a stage of the funnel, you guarantee that every experiment moves a real business metric.
Why Scientific Discipline Beats Gut Marketing
Marketing intuition still matters-but only after the data has framed the question. When teams rely solely on instinct, they over-index on novelty and under-measure impact. A disciplined loop flips that dynamic: creativity becomes the spark that feeds structured learning.
Over time, this creates an evidence moat. Competitors can copy your tactics, but not your accumulated knowledge about what truly drives your users. That knowledge-stored in your experiment log-is a defensible growth advantage.
From Testing to Learning Velocity
Most teams track campaign volume or ROAS. Few measure learning velocity: the number of validated insights generated per quarter. Learning velocity predicts long-term revenue growth more reliably than media spend.
If your team runs 20 experiments a month and 30% produce actionable insight, you've gained six new learnings. Each learning compounds across channels-improving creatives, CRM flows, pricing, or UX simultaneously. Multiply that over a year and you outpace slower organizations even if their ad budgets are double.
The New Baseline: Data, Automation, and Agents
In 2025, speed and signal quality matter more than raw volume. Privacy changes, attribution loss, and smaller datasets mean you can't wait 30 days for statistical certainty. Automation and AI agents compress the cycle:
- Automations log experiments and pull results automatically.
- AI agents monitor funnels, propose new hypotheses, and generate summary reports.
- Bayesian and sequential testing allow confident decisions on smaller samples.
This fusion of method + automation converts experimentation from a linear process into a self-optimizing flywheel.
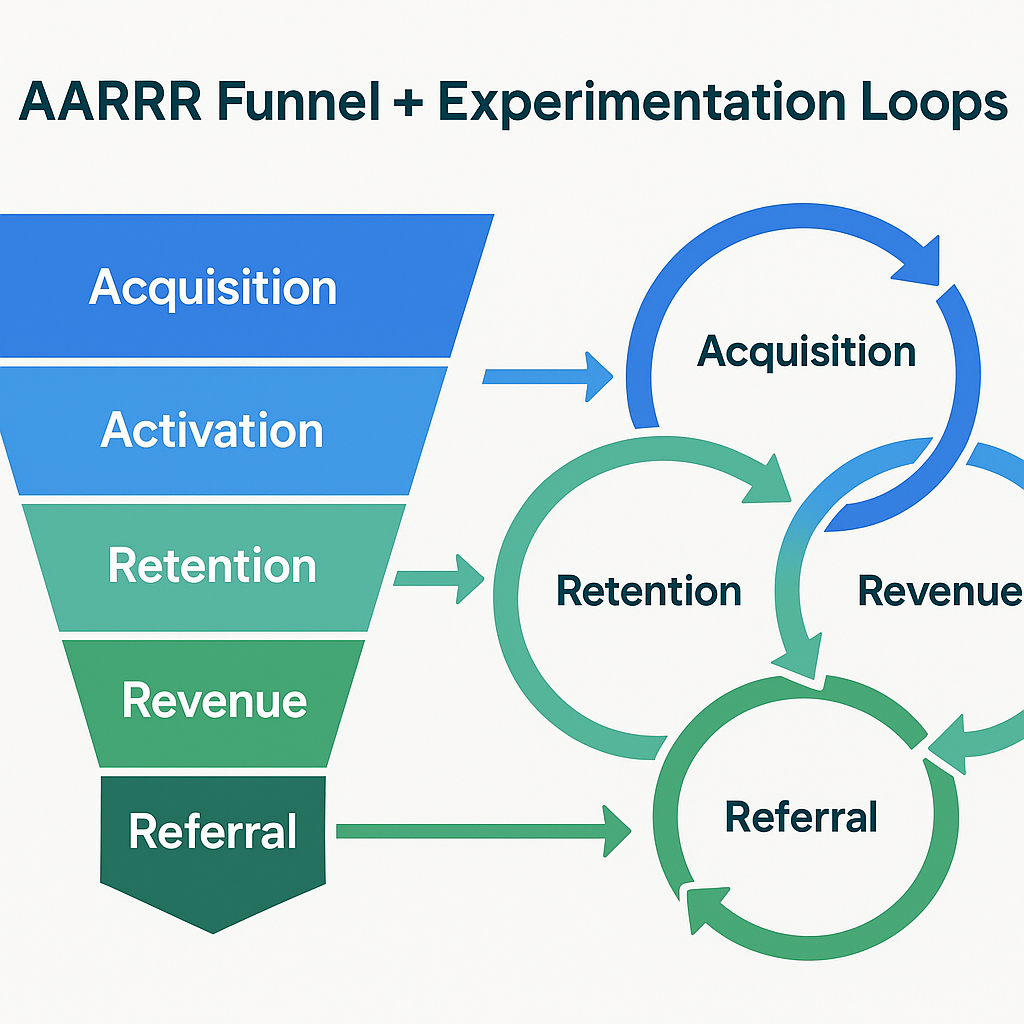
2. The Pirate Metrics (AARRR) Compass
Before you can build an experimentation engine, you need a funnel model that connects learning to money. That's where Pirate Metrics (AARRR) comes in: a framework introduced by Dave McClure that breaks growth into five measurable stages.
Acquisition - How users find you
Focus: traffic quality and CAC efficiency. Typical metrics: CTR, CVR, CAC, first-touch attribution accuracy.
Activation - How users experience their first "aha" moment
Focus: onboarding completion, first use, or account verification. Metrics: D0 sign-up rate, D1 activation, onboarding completion time.
Retention - How often they return
Focus: habit creation, product fit, lifecycle engagement. Metrics: D7, D30 retention, session frequency, churn rate.
Revenue - How you monetize
Focus: ARPU, subscription rate, CAC payback, LTV/CAC ratio.
Referral - How users promote you
Focus: word of mouth, virality, NPS, share rate, UGC volume.
This framework transforms experimentation from random curiosity into a system of compounding conversion improvements. Each stage represents a test bucket, and the purpose of your growth process is to reduce friction between stages.
For example, improving activation by 10% in a SaaS product typically lifts revenue by 12-15% because more users reach the monetization moment. Likewise, increasing retention by 5% can boost lifetime value by 20-25% according to 2025 SaaS benchmarks. The AARRR model gives you the skeleton on which every experiment can hang.
3. Designing the Experimentation System
A strong experimentation process needs infrastructure, cadence, and ownership. Think of it as a three-layer stack: data, automation, and governance.
a) Infrastructure: Connect Your Data Sources
To keep tests comparable and measurable:
- Centralize product, marketing, and CRM data into BigQuery or your analytics warehouse.
- Build a lightweight "Growth Log" in Google Sheets or Notion.
- Standardize fields: Experiment ID, Funnel stage (AARRR), Hypothesis, Owner, Expected metric uplift, Confidence threshold, Status (active, paused, completed), Outcome + revenue delta
This ensures every idea enters the same pipeline and every result is documented with context.
b) Metrics Layer: Unify Business and Behavioral KPIs
Many marketers measure engagement; few measure economic impact. Every metric in your system should roll up to three business levers:
- Efficiency (CAC, payback)
- Value (ARPU, LTV)
- Frequency (Retention, NPS)
Supporting metrics like CTR or bounce rate matter only if they shift these levers. By connecting behavioral KPIs (sign-ups, sessions, open rate) to revenue outcomes, you'll never debate which test mattered most.
c) Cadence: Build a Learning Rhythm
Consistency beats intensity. Set these recurring rituals:
- Weekly: active experiment sync (review progress, remove blockers).
- Monthly: growth review (summarize insights, link to revenue deltas).
- Quarterly: scale meeting (operationalize top performers in CRM or campaign automations).
Teams that follow this rhythm typically achieve 2-3× higher experiment velocity and 15-20% faster time to revenue lift.
4. Connecting Experiments to Revenue
Most companies stop at the uplift. "Variant B improved conversion by 8%." But what does that mean financially? The answer determines whether to scale, tweak, or discard the test.
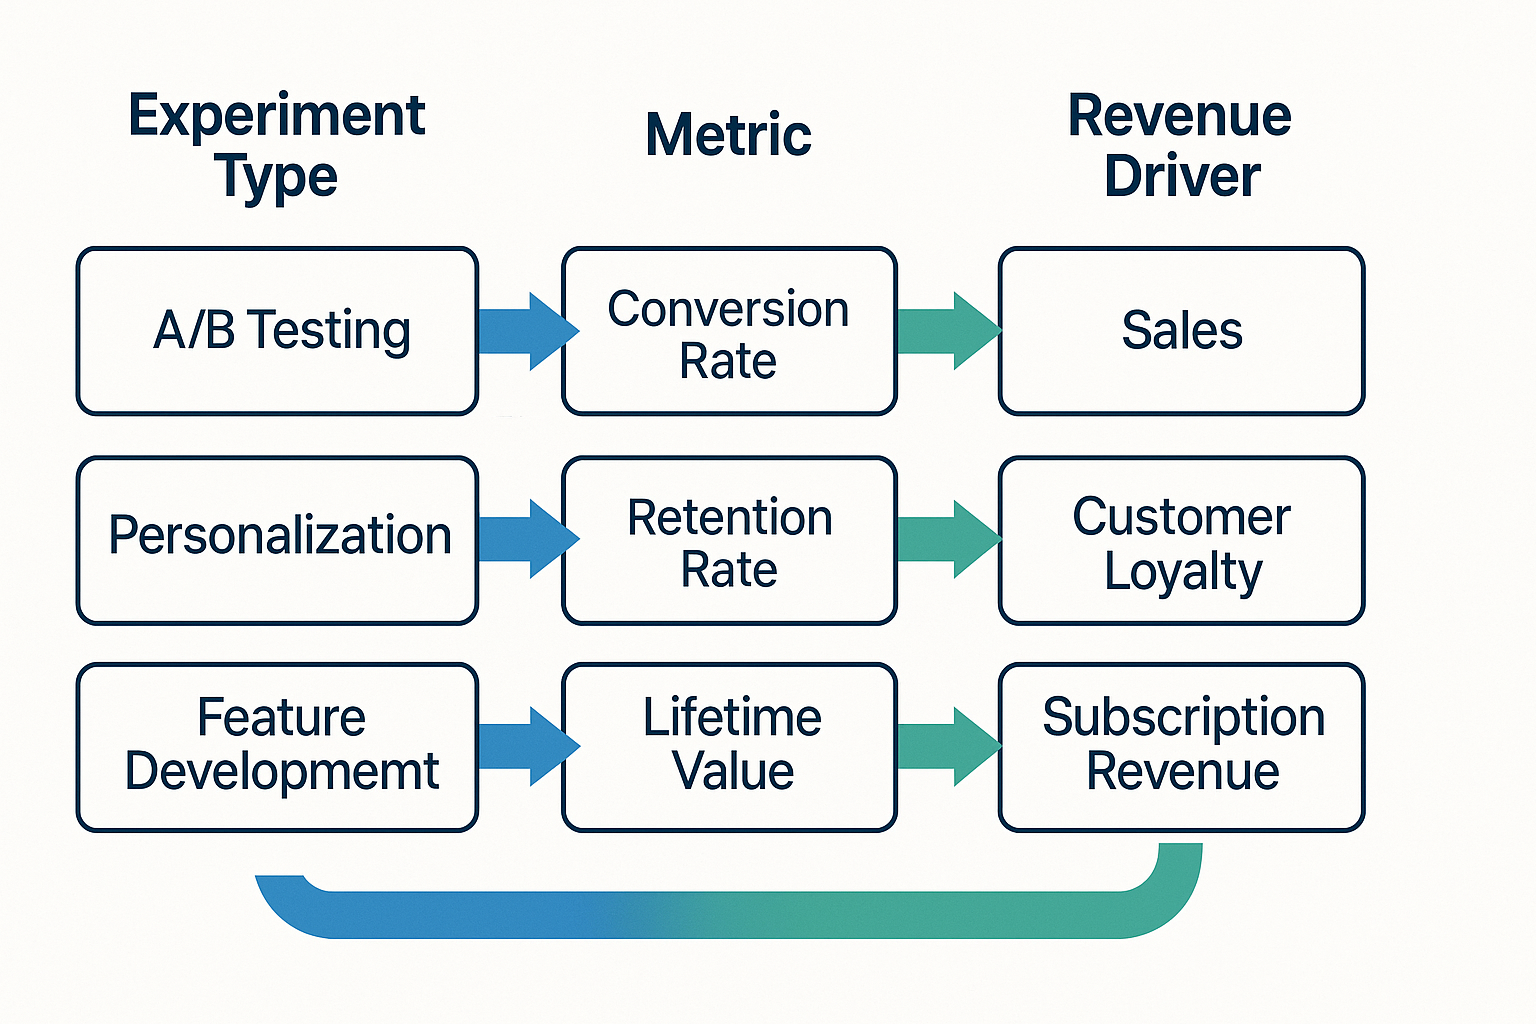
Every experiment should tie directly to one of three revenue levers:
Conversion improvement (CRO and UX)
Example: simplifying pricing cards → +14% checkout conversion. Business impact: increases transactions and shortens payback.
Retention uplift (CRM, onboarding, lifecycle)
Example: triggered onboarding emails → +9% D30 retention. Business impact: extends LTV, improves CAC/LTV ratio.
Acquisition efficiency (Creative & Targeting)
Example: shifting 20% of spend to TikTok Spark Ads → -17% CAC. Business impact: lowers cost per user, freeing budget for reinvestment.
A strong Growth Log doesn't just store test outcomes; it quantifies financial deltas. That's what turns "marketing experiments" into business experiments.
5. Automation Layer
Automation isn't about removing humans. It's about removing latency-the dead time between insight and action. In an average organization, 30-40% of testing time is wasted on coordination, manual data pulls, and reporting.
By automating key steps, you convert static operations into a live growth system.
Teams using these workflows report a 35% faster experiment cycle and 60% less administrative drag.
Automation also enables transparency: everyone sees what's running, what's paused, and why. That visibility fosters accountability and cross-functional alignment.
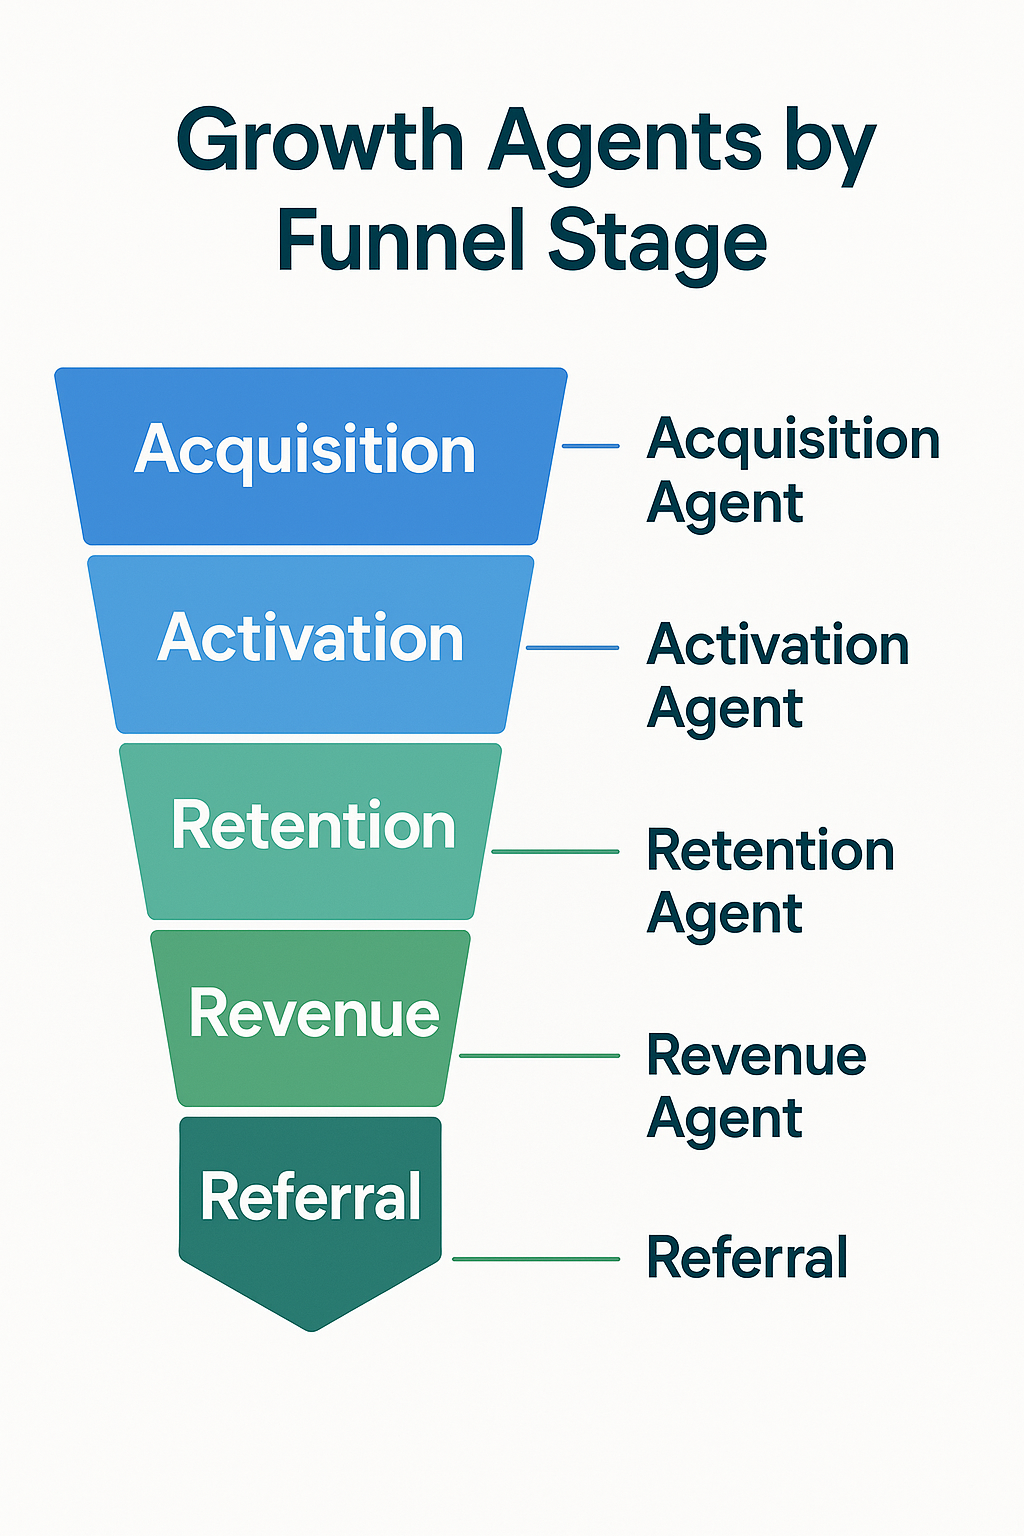
6. Growth Agents (AARRR)
By 2025, AI agents are not futuristic-they're practical assistants embedded in every growth stack. You can deploy them per funnel stage (AARRR):
These agents compress the research and interpretation phase-the slowest part of experimentation. Instead of waiting for analysts to summarize data, your Growth Log populates itself with AI-generated suggestions, impact estimates, and next steps.
When orchestrated together, agents become an always-on insight engine that keeps your pipeline full of validated ideas.
From Testing to Systemic Learning
At this stage, the line between marketing and data science blurs. You're no longer chasing clicks-you're designing a self-learning system that predicts, tests, and scales the next growth opportunity.
The end goal of automation and agents is not efficiency alone-it's compounding intelligence. Each new test makes the next one smarter. Each insight updates your future decisions. Within a year, your experimentation system becomes a proprietary model that no competitor can replicate.
7. Solving Choking Points
Even the most advanced growth systems face recurring bottlenecks that slow learning. They usually fall into three categories: data scarcity, inconclusive outcomes, and human latency. Each requires a different layer of automation, process, or AI support.
A. Low Data Volume or Sample Size
For early-stage startups or niche markets, reaching statistical confidence can take weeks. By then, the experiment's context has changed and the learning loses relevance. To address this, modern teams adopt probabilistic approaches and adaptive testing.
- Bayesian inference and sequential testing. Instead of waiting for 95% significance, Bayesian methods continuously calculate the probability that one variant outperforms another. You can decide with 80-90% confidence after far fewer users - ideal for low-traffic funnels.
- Multi-Armed Bandit (MAB) algorithms. Rather than splitting traffic evenly, MAB shifts more traffic to better-performing variants in real time. You learn and optimize simultaneously - shortening validation cycles by 30-60%.
- Synthetic data augmentation. Train small predictive models on past experiment results to simulate probable outcomes. For example, if you've run 20 onboarding tests historically, a model can predict which future variations are likely to win before spending budget.
Together, these techniques transform "I don't have enough data" into "I'm learning continuously, with the data I have."
B. Inconclusive or Flat Results
Roughly 70% of A/B tests fail to produce a significant difference. That's not necessarily failure - it's a sign that you're exploring a neutral zone. But inconclusive results become costly if you can't interpret them or recycle learnings.
To mitigate this:
- Use composite KPIs. Don't measure activation rate alone - measure an Activation Score that combines sign-up completion, first-session retention, and early monetization rate. Composite metrics reveal patterns missed by isolated stats.
- Set auto-fail conditions. Automate test termination if uplift remains within ±2% after X users or Y days. This prevents analysis paralysis and frees capacity for new ideas.
- Automated pre-validation. Before launching a test, use GPT or internal search agents to ask: "Has this hypothesis (or similar) been tested before? What was the outcome?" If the system flags a past test with similar logic and poor results, you pivot early.
The key is not avoiding flat results - it's extracting learnings faster and reducing time spent on non-movers.
C. Human Bottlenecks and Coordination Debt
The largest inefficiency in most growth teams isn't statistical - it's operational. Analysts are overbooked, PMs are waiting on data, and insights die in Slack threads. Here's how automation and agents fix that:
- Automated reporting. When an experiment closes, an AI agent drafts a short report: "Variant B improved D7 retention +8%, CAC payback shortened by 0.6 months, confidence 87%." These summaries post directly into Slack or Notion.
- Auto-tagging by funnel stage. Label each experiment by AARRR stage and vertical. This enables meta-analysis: Activation tests deliver 65% of all positive ROI; Revenue tests deliver 20%.
- Insight summarization. Once per month, a summarization agent clusters learnings into themes - "Frictionless onboarding" or "Urgency messaging." These become your next quarter's hypothesis backlog.
With these automations, your experimentation flywheel runs 24/7. Human creativity focuses on ideation, not administration.
💡 Outcomes
Teams using these approaches report 35% faster experiment cycles, 60% less administrative overhead, and 2-3x higher learning velocity.
Ready to Build Your Growth Experimentation System?
Already running experiments but need help with AARRR framework, automation, and AI agents? Book a Free Growth Audit Sprint - I'll analyze your current testing velocity, identify bottlenecks, and create a roadmap for systematic growth.
8. Culture, Roles & Prioritization
Technology enables speed, but culture sustains it. Without cultural buy-in, experimentation collapses into ad-hoc projects that vanish after leadership changes.
Building a Culture of Experimentation
A healthy experimentation culture is built on four pillars: ownership, transparency, safety, and velocity.
- Ownership: Every team member should own one stage of the funnel (AARRR). Growth Lead → acquisition; Product Lead → activation; CRM Lead → retention. This ensures distributed accountability for progress.
- Transparency: Public dashboards or weekly digests ensure visibility. Everyone knows which tests are running and what they aim to achieve.
- Psychological safety: Encourage "failed" experiments to be celebrated as learnings. A 0% uplift that disproves a wrong assumption saves future spend.
- Velocity: The team's success metric is learning velocity, not win rate. A 40% win rate with 10 experiments is worse than a 25% win rate with 40 experiments.
When your people equate "testing" with "progress," you've built a genuine growth culture.
Roles and Responsibilities
To keep this machine running, define clear roles:
- Growth Lead: Aligns experiments with company OKRs and ensures learning loops close.
- Data Analyst: Validates statistical confidence and estimates financial impact.
- Marketer / PM: Translates hypotheses into testable variants.
- UX / CRM Lead: Implements winning learnings into product and communication flows.
- Automation Owner: Maintains n8n, API, and AI agents for smooth data flow.
These roles often overlap in smaller teams, but clarity of responsibility prevents "test orphans"-experiments launched and forgotten.
Prioritizing Experiments: The Revenue-Weighted ICE Framework
Traditional ICE scoring (Impact × Confidence × Ease) is solid but incomplete because it ignores revenue leverage. Add a fourth dimension: Revenue Weight.
Priority Score = Impact × Confidence × Ease × Revenue Weight
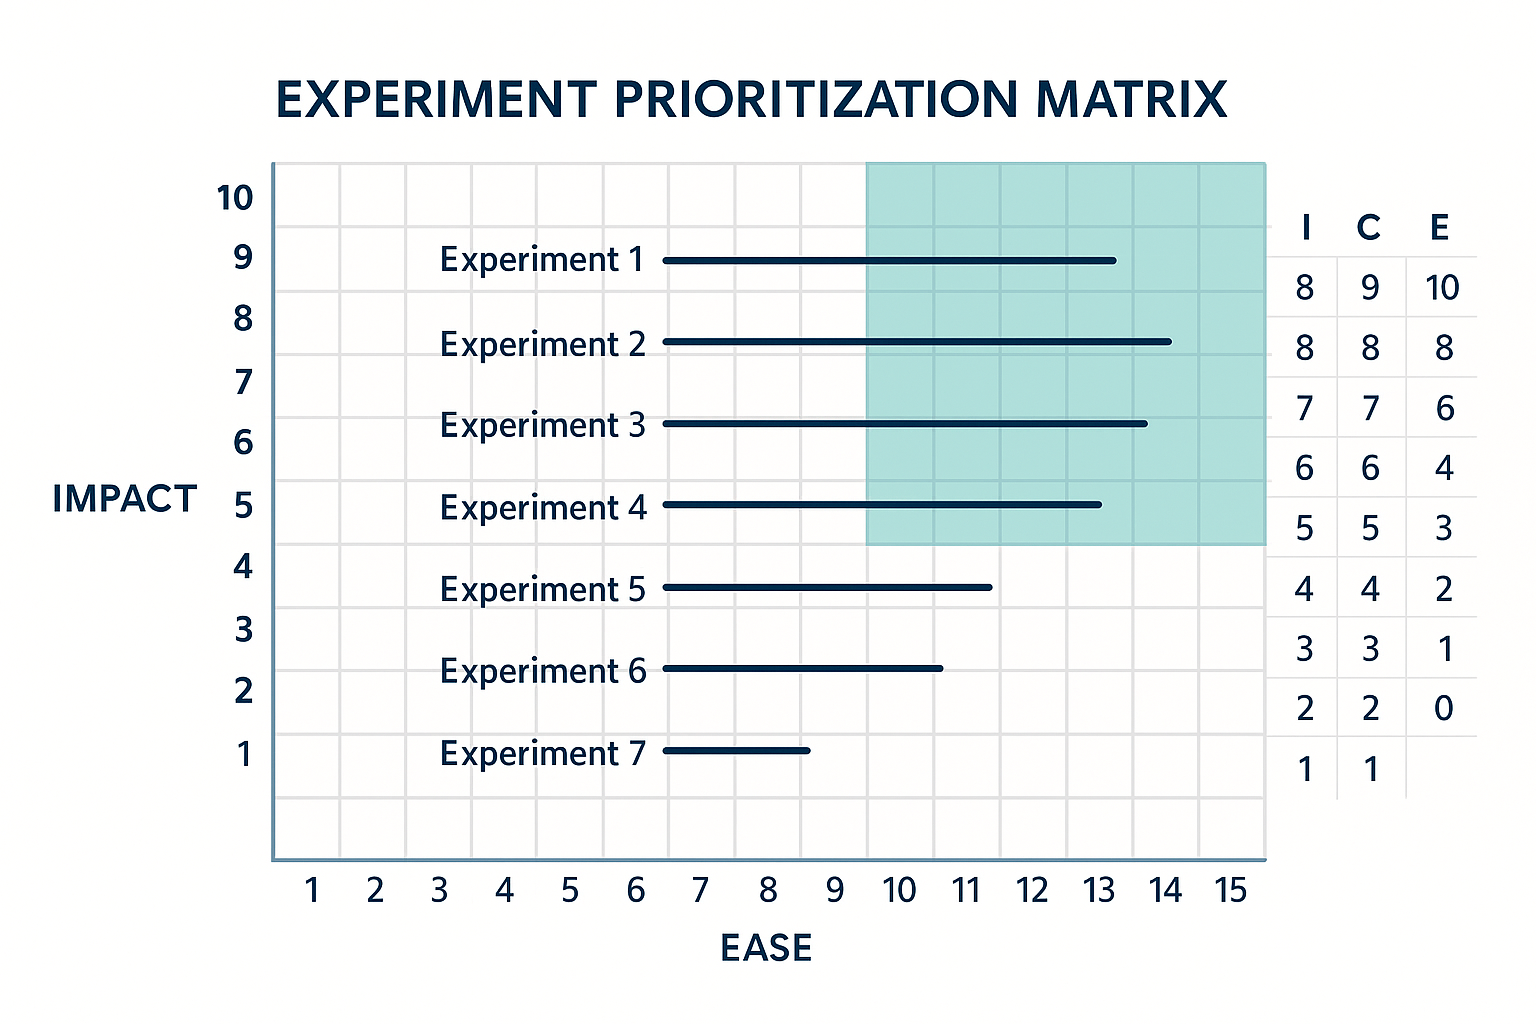
This approach ensures your highest-ROI ideas rise to the top, not just the easiest ones. Use automation to calculate and sort ICE scores automatically each week. When a new idea is logged, the system assigns a preliminary priority and routes it to the correct funnel stage owner.
9. Measuring System Performance
Growth experimentation is not just about individual results-it's about system efficiency. The following meta-KPIs measure the health of your learning engine:
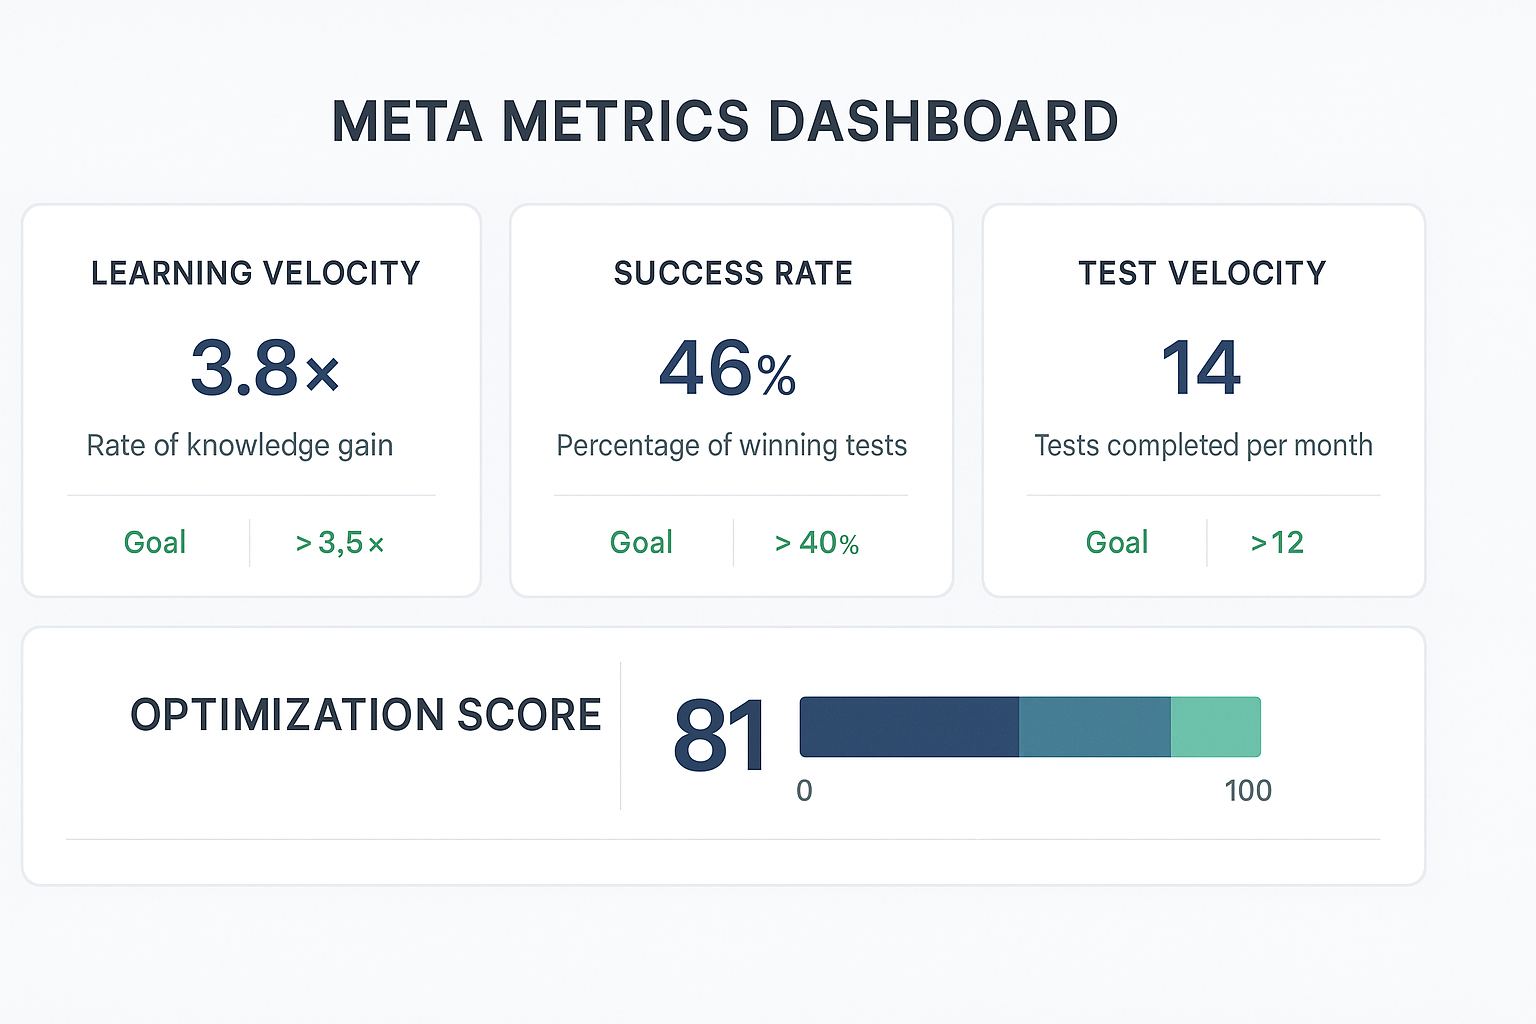
When these metrics improve, your entire growth process becomes self-optimizing. It's no longer about chasing big wins but sustaining small, frequent ones that compound faster.
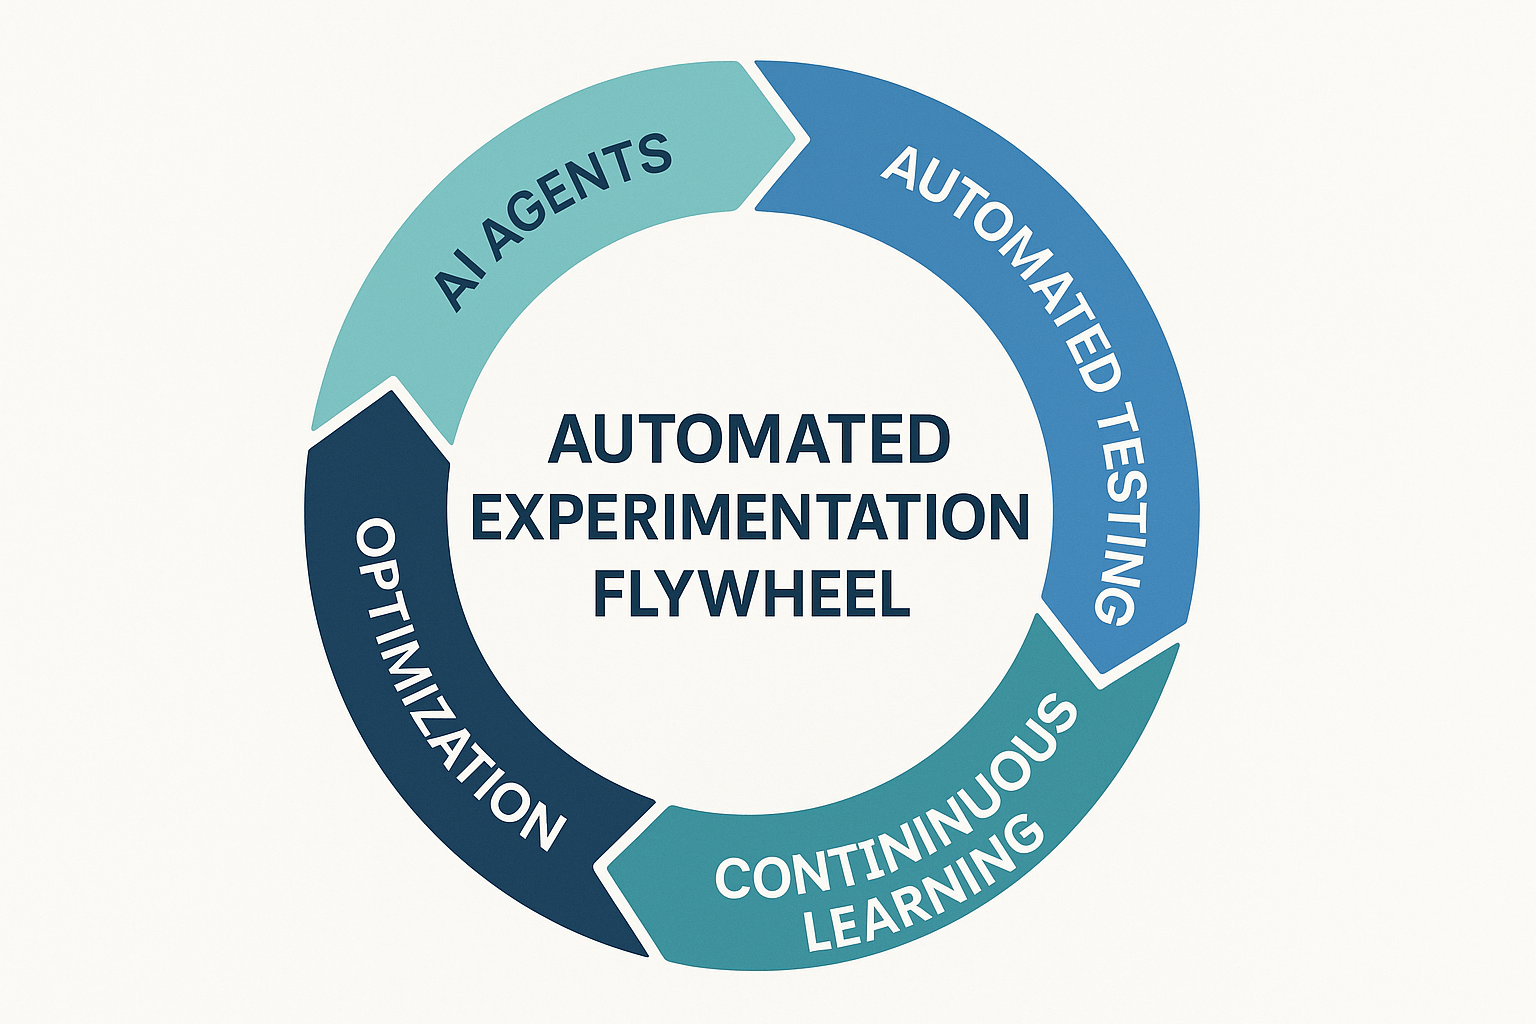
Visualizing the Experimentation Flywheel
Think of your experimentation system as a closed loop:
Data → Hypothesis → Test → Result → Insight → Automation → New Hypothesis
Each completed cycle generates knowledge that feeds the next. When powered by automation and agents, this loop spins continuously - even while your team sleeps.
Your growth system becomes less dependent on individual ideas and more on the process itself. That's how modern companies achieve scalability without burning out their teams or ad budgets.
10. Future of Growth Experimentation (2025-2026)
By late 2025, experimentation is shifting from manual optimization toward predictive orchestration. The tools are maturing, privacy rules are stable, and LLM-powered analytics have replaced dashboards with natural-language intelligence. We are entering a stage where experiments will design and prioritize themselves.
Three Major Trends Define This Next Wave
1. Schema-Driven Experimentation
Until now, every experiment lived in spreadsheets or Notion. But in 2026, most mature growth organizations will shift toward schema-driven experimentation, where data flows automatically from analytics and CRM systems into structured "Experiment Objects."
Each object includes: Funnel stage (AARRR), Hypothesis statement, Metrics and target deltas, Associated agent(s), Past related tests (for context), Revenue linkage (payback, LTV delta), Owner and confidence level
This structured schema allows agents to detect similar historical tests automatically, predict success probability, and recommend control variables for better comparability. Essentially, you're teaching your experimentation system to remember and reason. It no longer asks, "What should we test?" but rather, "Which of these five ideas is most likely to move revenue fastest?"
2. Multimodal & Voice Data in Growth Loops
Experimentation is expanding beyond clicks and signups. With the rise of multimodal interfaces-voice, video, chat-the next optimization frontier will involve intent recognition and emotion analytics.
Example: Voice tone analysis during support calls feeds into churn prediction. Eye-tracking and sentiment models detect hesitation during onboarding flows. Chatbot transcripts reveal objection patterns that guide copy experiments.
Privacy-safe models trained on these signals will help teams design contextual experiments-ones that adapt copy, design, or timing based on real human behavior rather than aggregated metrics. In this future, you'll measure not just what users do, but how they feel while doing it.
3. Agent Coordination: The Self-Learning Funnel
Individual agents (Acquisition, Activation, Retention, Revenue, Referral) already accelerate insight generation. But in the coming cycle, these agents will begin collaborating across the funnel.
Example workflow: The Retention Agent detects churn risk spiking in Segment B. It pings the Activation Agent, suggesting new onboarding variants that better prepare users from that segment. The Revenue Agent estimates expected LTV increase if churn drops 5%. The Mix Allocator (linked to your marketing spend tool) reallocates 10% of paid media toward high-retention cohorts. The CRO Agent automatically drafts new email and landing copy variants for validation.
Each stage informs the next-creating a multi-agent growth loop that continually optimizes both funnel flow and spend efficiency. By 2026, this won't be a concept. It'll be a baseline expectation for performance marketing and product growth teams.
Predictive Experimentation and Revenue Modeling
Modern experimentation systems will soon integrate predictive LTV modeling and real-time financial simulation. This means you'll know, in advance, which experiments will have the most impact on payback and profitability.
Here's how it works: Input historical data. Every past test becomes a record-hypothesis, metric delta, and business outcome. Train a prediction model. The system learns which variable patterns lead to measurable revenue impact. Score new ideas. Every new experiment gets a Revenue Impact Score (RIS) based on similarity to high-yield tests. Prioritize automatically. Experiments with higher RIS values surface first in your queue.
Imagine running a weekly experiment review where the AI already ranks next week's ideas by expected ROI. That's no longer theory-it's happening in advanced B2C and SaaS organizations today.
When experimentation becomes predictive, growth planning becomes proactive instead of reactive. You're no longer guessing what to test-you're continuously validating the model's recommendations.
Ethical & Privacy-First Experimentation
A final pillar of future experimentation is responsible optimization. As models grow more powerful, governance and transparency must evolve alongside speed.
Key principles for 2025-2026: Always disclose experiment participation when applicable. Store anonymized datasets only. Document each experiment's intent and potential customer impact. Audit agent behavior to ensure no discriminatory bias in targeting or creative generation.
Responsible experimentation not only protects your brand-it builds trust, which ultimately boosts retention and referral metrics. Transparency and privacy compliance will soon become ranking signals in AI-overview-driven discovery. The same way backlinks once defined SEO authority, ethical transparency will define AEO trust scores.
Measuring the ROI of Learning Velocity
By now, your experimentation system is a living organism-testing, learning, and optimizing itself. But even automated systems need KPIs. The most advanced teams track learning velocity as a core business metric.
To calculate it: Learning Velocity = (Actionable Insights per Month / Average Experiment Duration) × Confidence Factor
For example: 10 experiments per month, 60% generate validated insights, Average duration = 7 days → Learning Velocity = (6 / 7) × Confidence 0.85 ≈ 0.73 learnings/day
Benchmark: top-performing growth organizations operate at 0.7-1.0 learnings/day, meaning they validate one new insight every working day. The higher your learning velocity, the faster your compounding curve - because every new test improves all future decisions.
The Revenue Impact of Experimentation Systems
Across 2024-2025 benchmarking studies (CXL, Mixpanel, and Growth.Design), companies that implemented structured experimentation systems achieved:
- +18% average improvement in activation rates
- +22% improvement in retention
- +15% increase in marketing efficiency (lower CAC)
- +30-40% faster payback period on new customers
Over a year, that can translate into millions in incremental profit with no increase in marketing spend. That's the compounding magic of structured learning. When your experiments are connected to financial metrics, every optimization turns into a business case-easy to justify, easy to scale, and easy to celebrate.
Common Pitfalls to Avoid
As you scale experimentation, watch for these traps:
- Test overload: Too many concurrent tests distort data quality.
- Metric drift: Teams optimize for convenience metrics (CTR, time on site) instead of core business KPIs.
- Learning decay: Insights aren't documented, leading to repeated mistakes.
- Tool sprawl: Multiple testing platforms create fragmented data ecosystems.
- Leadership impatience: Executives expect immediate results instead of cumulative ROI.
Combat these by maintaining a single source of truth, clear measurement hierarchy, and executive education on learning ROI. A well-informed leadership team is the greatest enabler of sustainable experimentation.
Ready to Build Your Experimentation System?
Growth experimentation isn't about more A/B tests-it's about building a machine that learns faster than your competitors. When your experiments are tied to AARRR metrics, automated through workflows, and interpreted by intelligent agents, you transform guesswork into predictable revenue.
You move from: Gut → Evidence, Projects → Systems, Reports → Compounding knowledge
Experimentation becomes the operating system of your growth function. It scales without burning people out. It proves ROI without extra budgets. It keeps your brand relevant in a world where user behavior and algorithms change weekly.
Need Strategic Advisory?
Already using the Growth Experimentation framework but need help with AARRR implementation, automation setup, and AI agents? Book a Free Growth Audit Sprint - I'll analyze your current testing velocity, identify bottlenecks, and create a roadmap for systematic growth.
Final Takeaway
Don't just run experiments. Don't just collect data. Build the system that turns every data point into a learning-and every learning into profit.
Growth doesn't belong to the teams that move the fastest. It belongs to the ones that learn the fastest-and automate that learning until it becomes unstoppable.
Growth Experimentation FAQs
What's the difference between testing and experimentation?
Testing is running A/B tests to see what works. Experimentation is a systematic process that includes hypothesis formation, data collection, analysis, and learning documentation. True experimentation builds institutional knowledge and compounds over time, while testing often produces isolated wins that don't scale.
How do I calculate learning velocity for my team?
Learning Velocity = (Actionable Insights per Month / Average Experiment Duration) × Confidence Factor. For example: 10 experiments/month × 60% success rate ÷ 7 days average duration × 0.85 confidence = 0.73 learnings per day. Top teams achieve 0.7-1.0 learnings per day.
What tools do I need to start a growth experimentation system?
Start with: 1) Analytics platform (GA4, Amplitude), 2) Testing tool (Optimizely, VWO, or built-in), 3) Growth log (Google Sheets or Notion), 4) Data warehouse (BigQuery), 5) Automation tool (Zapier, n8n). Add AI agents and advanced analytics as you scale.
How do I prioritize experiments when I have limited resources?
Use the Revenue-Weighted ICE framework: Impact × Confidence × Ease × Revenue Weight. Focus on experiments that move your core business metrics (CAC, LTV, retention) rather than vanity metrics. Start with high-confidence, high-impact tests that require minimal effort.
What's the minimum sample size for reliable experiment results?
Traditional significance testing requires 1,000+ users per variant. For faster decisions, use Bayesian methods (80-90% confidence) or Multi-Armed Bandit algorithms that adapt in real-time. Early-stage companies can start with 200-500 users per variant using sequential testing approaches.
How do I build a culture of experimentation in my organization?
Focus on four pillars: 1) Ownership (assign funnel stages to team members), 2) Transparency (public dashboards and weekly reviews), 3) Psychological safety (celebrate failed experiments as learnings), 4) Velocity (measure learning speed, not just win rate). Start with small wins and gradually expand scope.
Author

Ready to Scale Your Growth Experiments?
Book a free strategy call to discuss your growth experimentation strategy and see how I can help.
Book a 30-minute Free Strategy Call
Use this short call to discuss your experimentation challenges, review your current approach, and explore optimization opportunities.